Capturing Data Packets Using Wireshark
Learn more about Wireshark
Capturing data packets on Wireshark
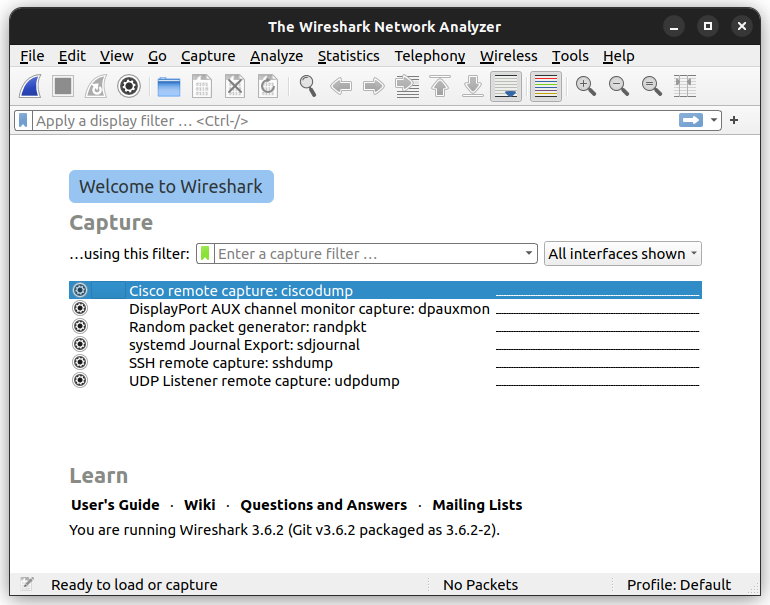
When you open Wireshark, you see a screen showing you a list of all the network connections you can monitor. You also have a capture filter field to only capture the network traffic you want to see.
You can select one or more of the network interfaces using shift+left-click. Once select the network interface, you can start the capture, and there are several ways to do that
Starting the capture
You can start on capturing packets by clicking on the blue wireshark icon or click on capture, then the icon, or use the windows shotcut Ctrl + E.
You shouls a screen similar to the following:
Once you have captured all the packets needed, use the same buttons or menu options to stop the capture as you did to begin.
Conducting Packet Analysis
Analyzing Data Packets on Wireshark
Wireshark provides a comprehensive interface for inspecting packet data, utilizing three distinct panes. This guide details each pane and its functionalities, helping you to effectively analyze network traffic.
1. Packet List Pane
The Packet List is the top pane that lists all the packets captured during a session. Each row represents a single packet, and clicking on a packet will update the other two panes with detailed information about the selected packet.
- No.: This column indicates the sequence number of the packet in the capture file. A bracket around the number signifies that the packet is part of a conversation.
- Time: Shows the timestamp of when the packet was captured relative to the start of the capture session. You can adjust this display to show the absolute time, time delta, or other formats via the Settings menu.
- Source: Displays the IP address or hostname of the sender of the packet.
- Destination: Displays the IP address or hostname of the receiver of the packet.
- Protocol: Identifies the protocol used by the packet, such as TCP, DNS, DHCPv6, or ARP.
- Length: Indicates the size of the packet in bytes.
- Info: Provides additional details about the packet, which vary depending on the protocol. For instance, it might show the HTTP request method, DNS query, or TCP flags.
2. Packet Details Pane
The Packet Details pane, located in the middle, displays a structured, hierarchical view of the packet’s contents. This pane breaks down the packet according to the protocol layers, from the Ethernet header to the application layer data.
- You can expand and collapse sections to explore specific fields within the packet.
- Right-clicking on any field allows you to create display filters based on the selected text. This can be useful for isolating packets with specific attributes or values.
3. Packet Bytes Pane
The Packet Bytes pane, at the bottom, shows the raw data of the packet in a hexadecimal and ASCII format. This view represents the exact data as captured by Wireshark, providing a byte-by-byte representation.
- This pane is particularly useful for low-level troubleshooting and when you need to see the precise byte sequence in the packet.
- Highlighting bytes in this pane will simultaneously highlight the corresponding fields in the Packet Details pane, and vice versa.
Wireshark Capture Filters
Capture filters in Wireshark allow you to limit the packets captured by specifying criteria that packets must meet to be saved. These filters are set before starting the capture and help reduce the volume of data, focusing only on relevant traffic. Here are some common capture filters:
- host IP-address: Captures all traffic to and from the specified IP address.
host 192.168.1.1
- net 192.168.0.0/24: Captures all traffic within the specified subnet.
net 192.168.0.0/24
- dst host IP-address: Captures only packets sent to the specified IP address.
dst host 192.168.1.1
- port 53: Captures traffic on port 53, which is commonly used for DNS queries.
port 53
- port not 53 and not arp: Captures all traffic except DNS (port 53) and ARP traffic.
port not 53 and not arp
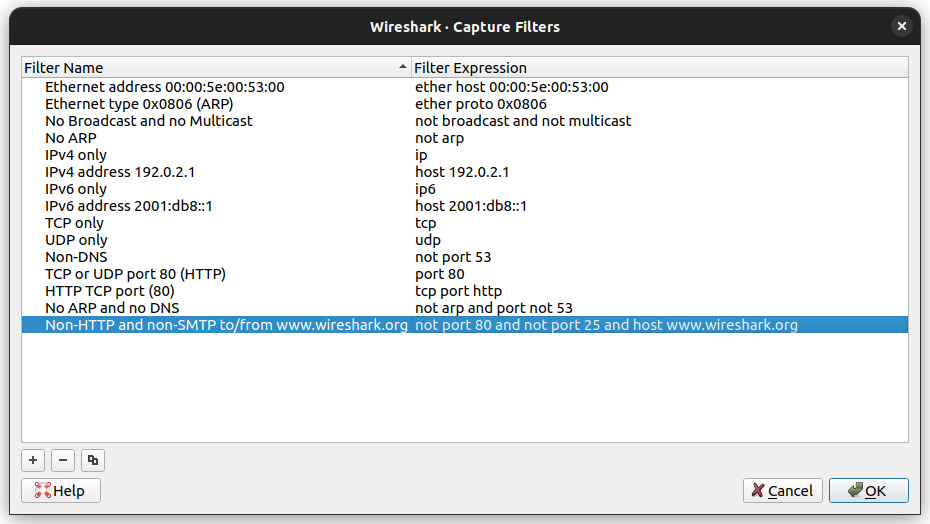
You can check the capture filters by clicking on Capture, then Capture Filters. You should see something like this:
Wireshark Display Filters
Display filters in Wireshark allow you to refine the view of captured packets during analysis. These filters do not affect the data captured but help narrow down the packets shown in the Packet List pane, making it easier to troubleshoot specific issues. Here are some useful display filters:
- ip.src == IP-address and ip.dst == IP-address: Shows packets sent from one IP address (source) to another IP address (destination).You can also use
ip.src == 192.168.1.1 and ip.dst == 192.168.1.2ip.addrto show packets to and from the specified IP address:ip.addr == 192.168.1.1 - tcp.port eq 25: Shows all traffic on port 25, typically used for SMTP email traffic.
tcp.port eq 25 - icmp: Shows only ICMP traffic, which is commonly used for ping requests.
icmp - ip.addr != IP_address: Shows all traffic except the traffic to or from the specified IP address.
ip.addr != 192.168.1.1
Analysts can also create custom filters to detect specific types of network activity or attacks. For example, to detect the Sasser worm, you might use the following filter:
- ls_ads.opnum == 0x09: Detects packets related to the Sasser worm.
ls_ads.opnum == 0x09
Using Filters Effectively
- Setting Capture Filters: Before starting your capture, set appropriate capture filters to focus on relevant data and reduce the size of the capture file. This can improve performance and make analysis more manageable.
- Applying Display Filters: After capturing data, use display filters to isolate specific traffic patterns or troubleshoot issues. Display filters can be combined and layered to create precise views of the data.
- Custom Filters: For specialized needs, such as detecting security threats or analyzing specific protocols, create and save custom filters. This enhances your ability to quickly respond to network events and anomalies.
By mastering the use of capture and display filters, you can efficiently analyze network traffic and identify issues using Wireshark.
Last updated 04 Sep 2024, 13:45 +0530 .


